A 360° view of your sales,
built from your ERP data.
WyzeSales connects directly to your ERP or accounting database and syncs every night. Every customer, sales person, product, area and month, analysed from every angle, with customer segmentation, item segmentation, budgets, targets, alerts and AI insights built in. No exports. No spreadsheets.
Every number, from every angle
Your sales aren't one table. They're people, customers, products, places and time, all at once. WyzeSales lets you look at the same numbers through any of them, and combine them.
- Sales peopleWho sold it, against what target
- CustomersCustomer, category and segment
- ProductsItem, category, range, group, type
- TimeFinancial year, quarter, month
- GeographyArea, region, country
- DocumentsEvery invoice and credit note
Filter by anything, combine anything
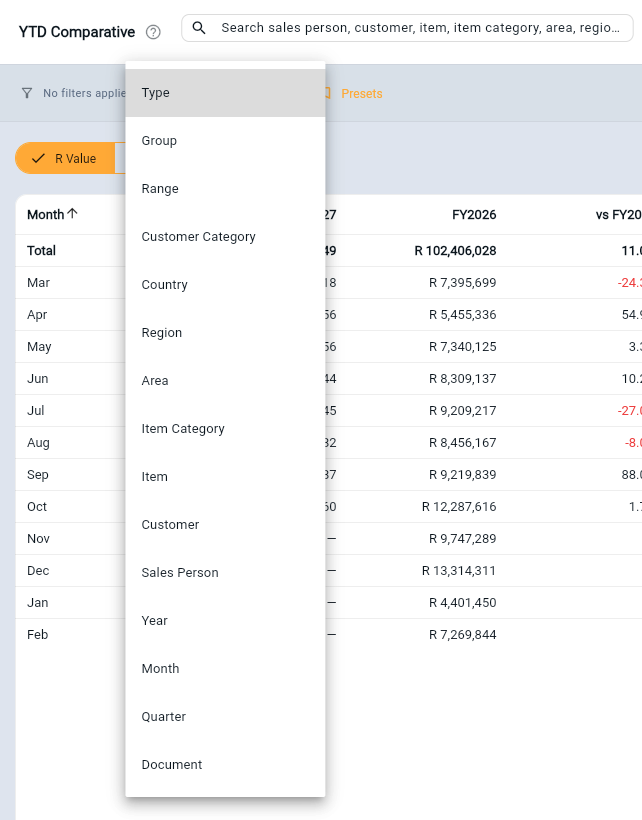
Narrow to one region, one customer category, one range, or all three together. Filters carry across the analysis screens, so the whole picture follows you.
From the big picture to the invoice line
Start at the dashboard, click into a customer or a segment, and keep going until you are looking at the individual document.
Side by side, not one at a time
Compare sales people, customers or products against each other, or this year against the last two, without building a single spreadsheet.
Everything you need to run sales, without leaving your ERP data behind
One platform for the numbers you already have: analysed, segmented, budgeted and forecast automatically, whatever system they live in.
Sales analysis
Drill into every invoice line by sales person, customer, item, category, area, region or country, in chart or table view, with your target overlaid.
Customer segmentation New
Every customer scored on how recently, how often and how much they buy, then sorted into plain-English segments with advice on what to do next.
Item segmentation New
Every item sorted by lifecycle and ranked A, B or C, so you can see what is growing, what is declining and which big sellers have quietly stopped.
Executive dashboard New
Six headline measures at a glance, with month, quarter and year views, and a breakdown of your top, bottom, diminishing and growing accounts.
Budgets & attainment
Set budgets per sales person or category and track attainment against what is actually landing, month by month.
Seasonal forecasting
Forecasts that understand your seasonality, with a confidence rating so you know how much to trust each number.
Year-on-year comparison New
This year against the last two, month by month and by any dimension, with totals that compare like for like.
Performance & coverage
% to target, rand gap, coverage still needed and margin by sales person or category, colour-coded so you see what needs attention.
Alerts New
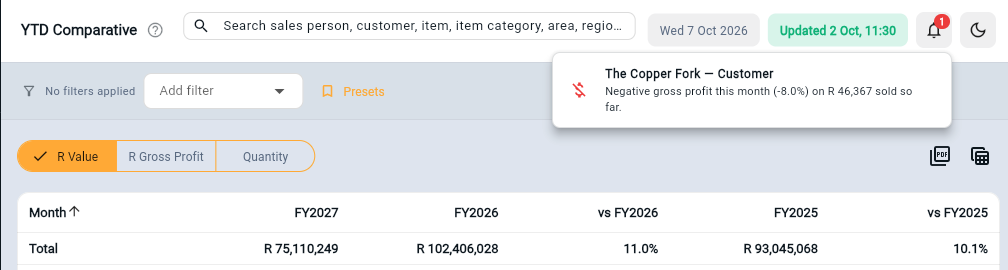
A bell that tells you when a customer, sales person or branch is selling at a loss, or running behind budget, before month end does.
Automatic ERP sync
A nightly extract keeps everything current, whatever ERP or accounting system you run. Nothing to export, nothing to remember to run.
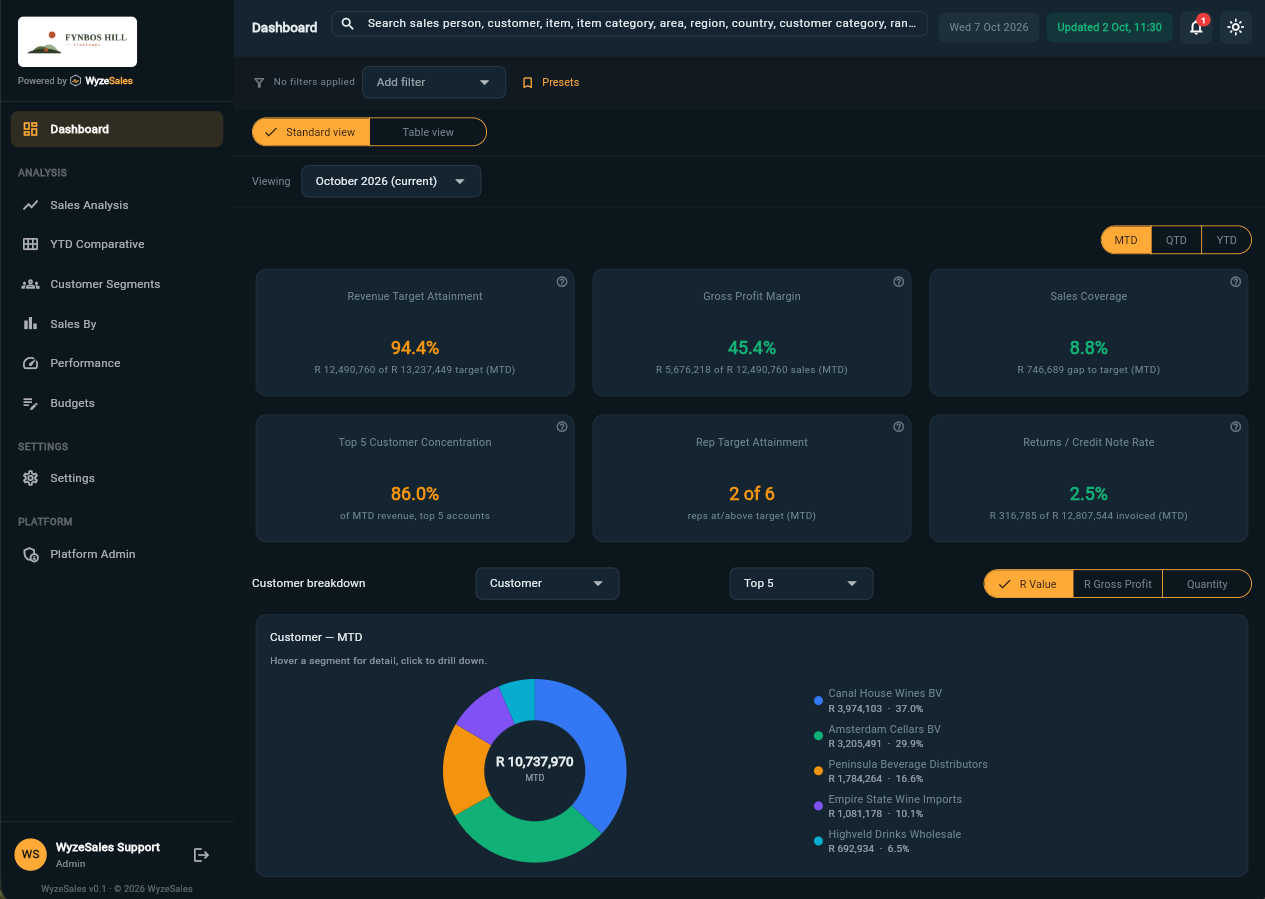
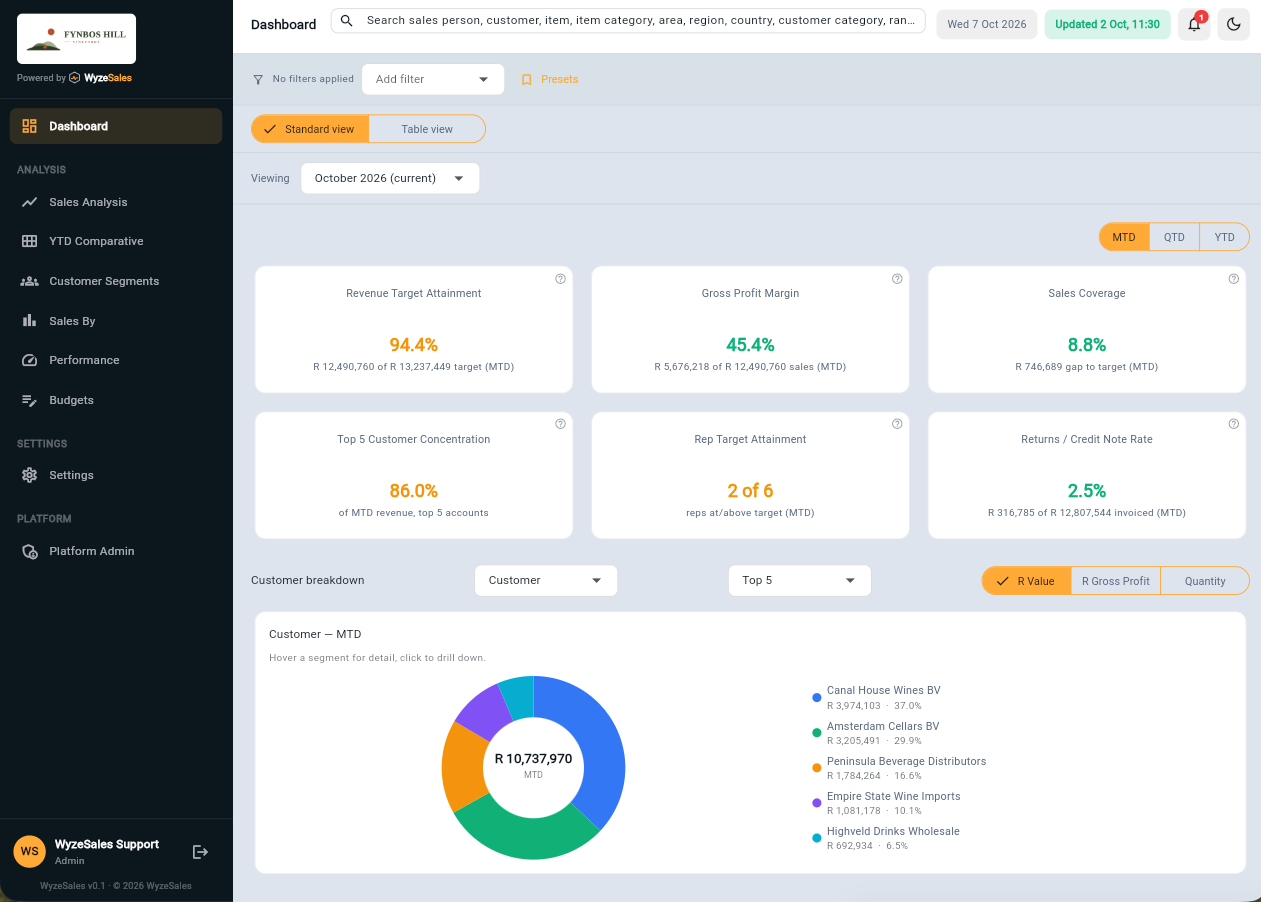
The state of the month in one look
Open WyzeSales and the answer to "how are we doing?" is already on screen, with the context to know whether to worry.
- Revenue target attainment, gross profit margin and sales coverage
- Top-5 customer concentration, so you know how exposed you are
- How many reps are at or above target, and your returns and credit note rate
- Month, quarter or year to date at a click
- Break sales down by any dimension: top 5, bottom 5, diminishing 5 or growth 5
Know who to thank, who to call, and who you are about to lose
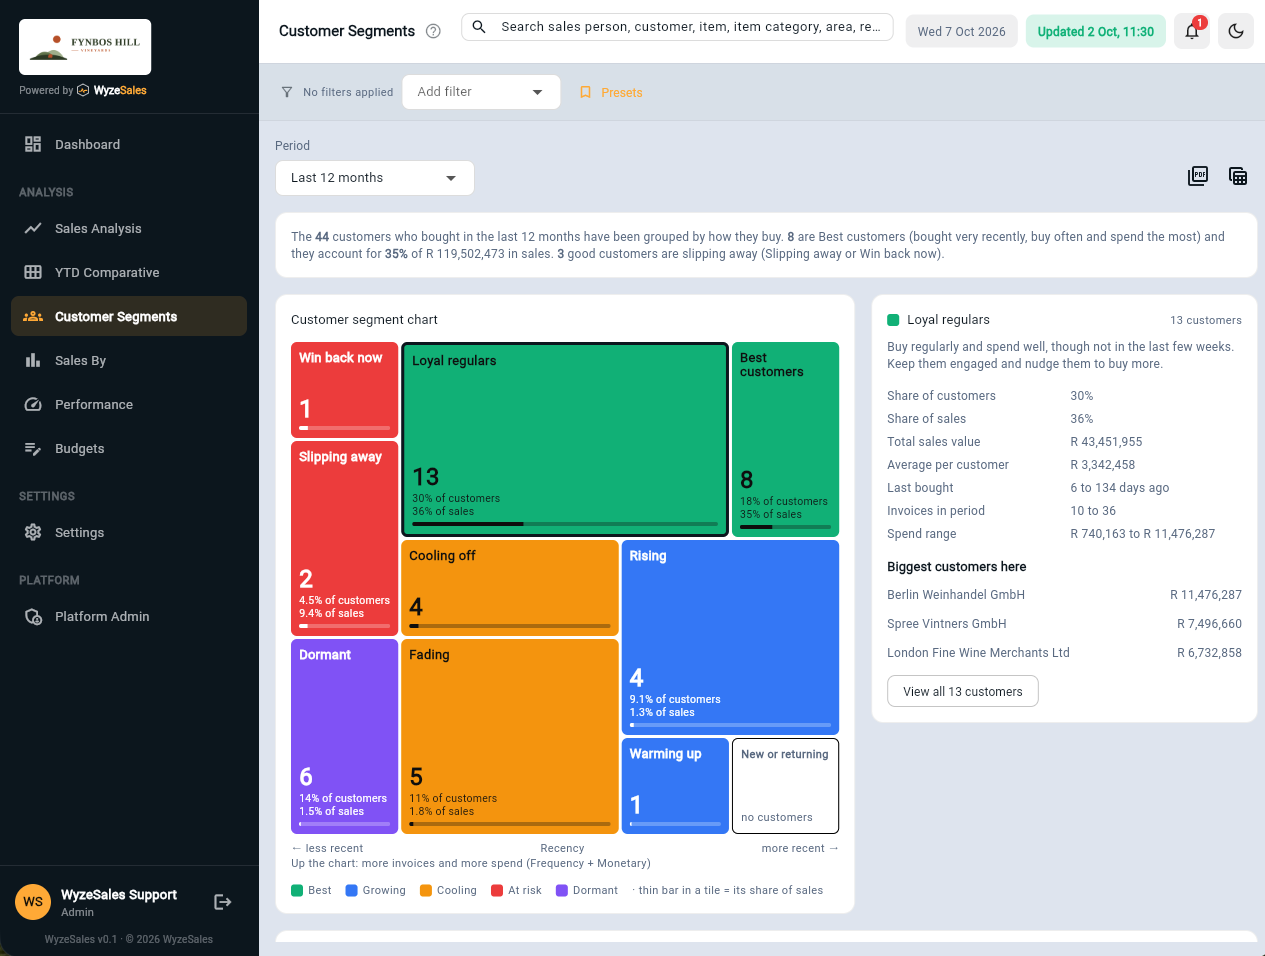
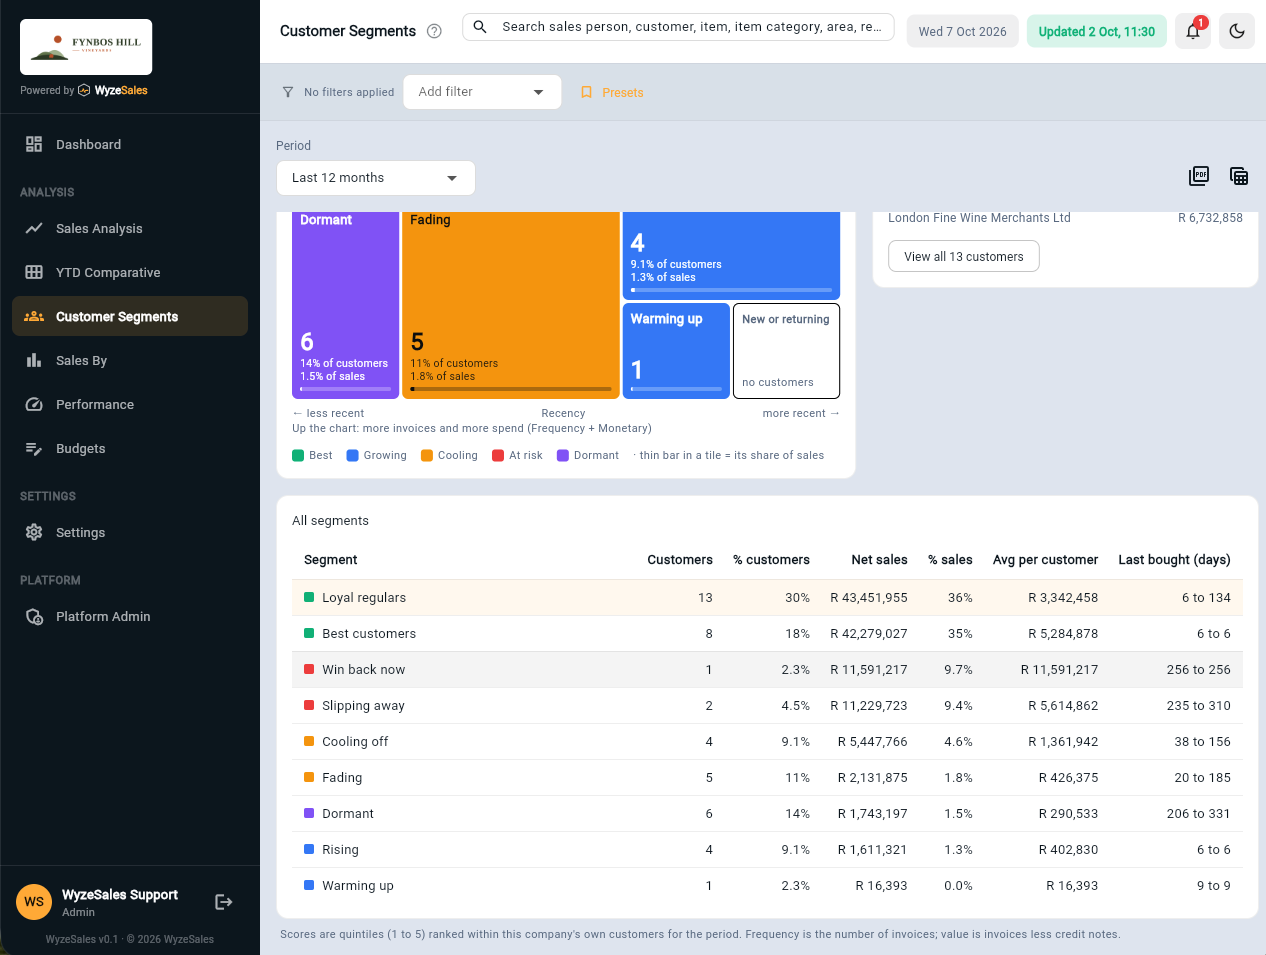
WyzeSales scores every customer on how recently they bought, how often, and how much they spend, ranked against your own customer base. Then it sorts them into ten plain-English segments, each with a suggestion on what to do.
- Best customers, Loyal regulars, Rising and Warming up, so you can nurture them
- Cooling off, Fading, Slipping away and Win back now, so you can act before they are gone
- Share of customers against share of sales, for every segment
- Click a segment to see exactly who is in it, then jump straight into their sales
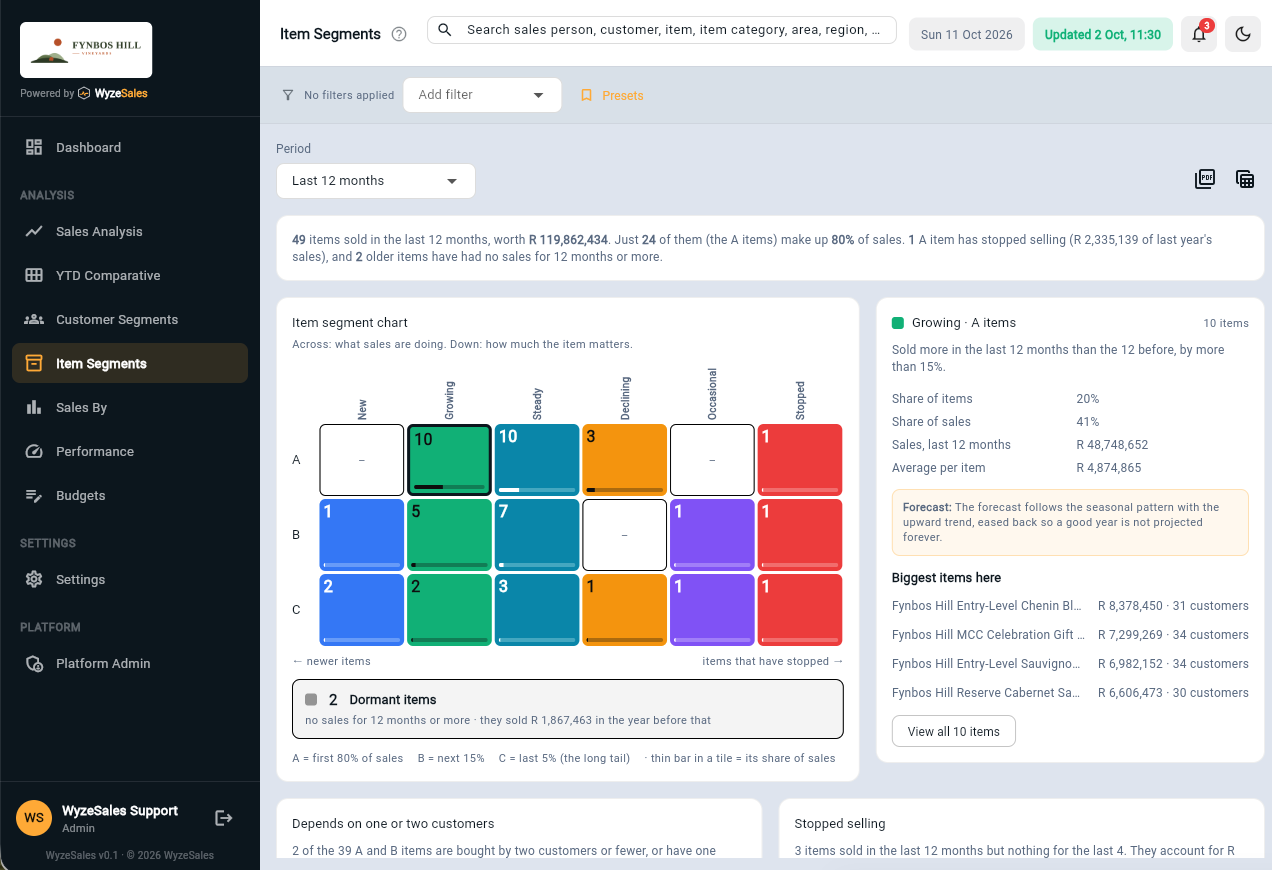
See which products carry your sales, and which have quietly stopped
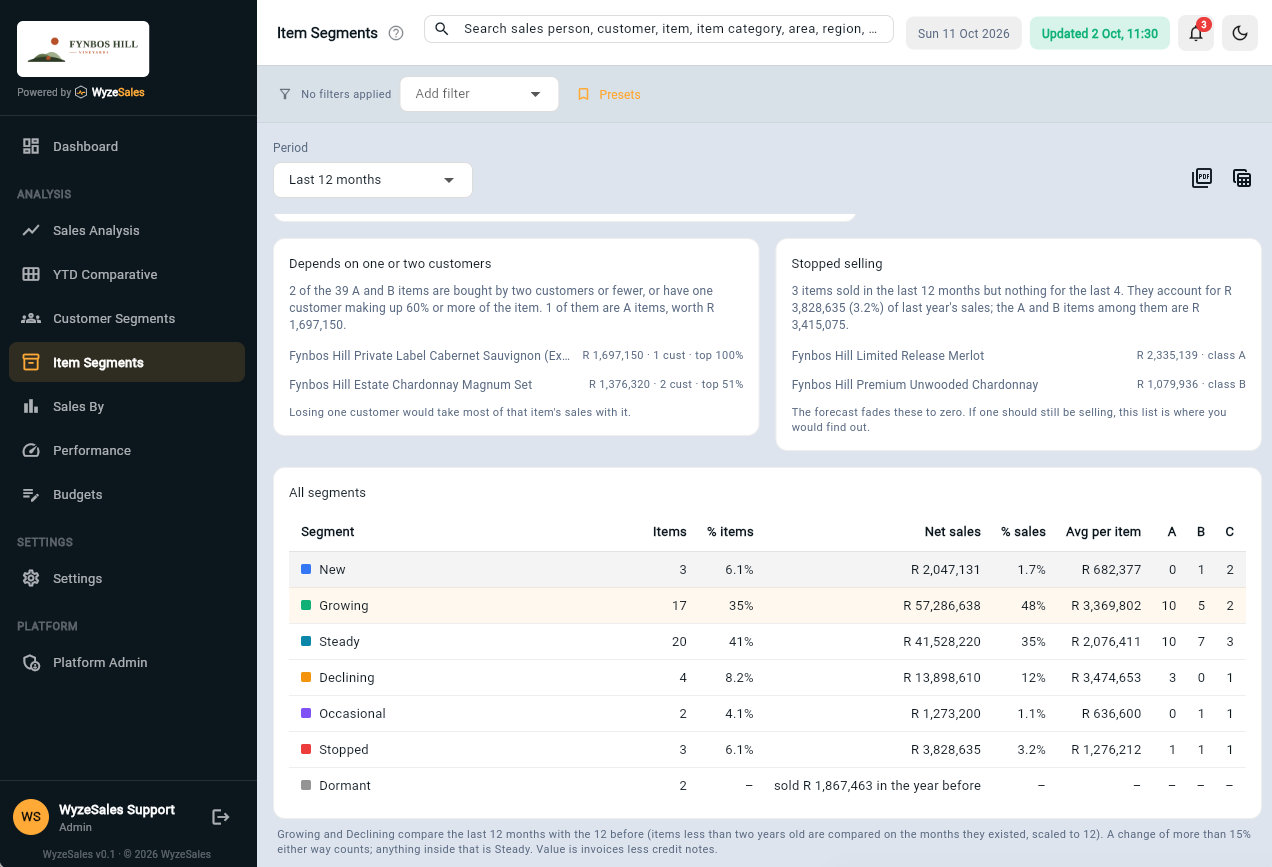
WyzeSales looks at every item over the last 12 months, sorts it into a lifecycle segment, and ranks it A, B or C by how much of your sales it carries. Then it shows you where to look first.
- New, Growing, Steady, Declining, Occasional and Stopped, each ranked A, B and C
- The big items that have stopped selling, so you can find out why
- A and B items that depend on one or two customers
- Click a tile to see the items in it, then jump straight into their sales
Start the day knowing what changed and who to call
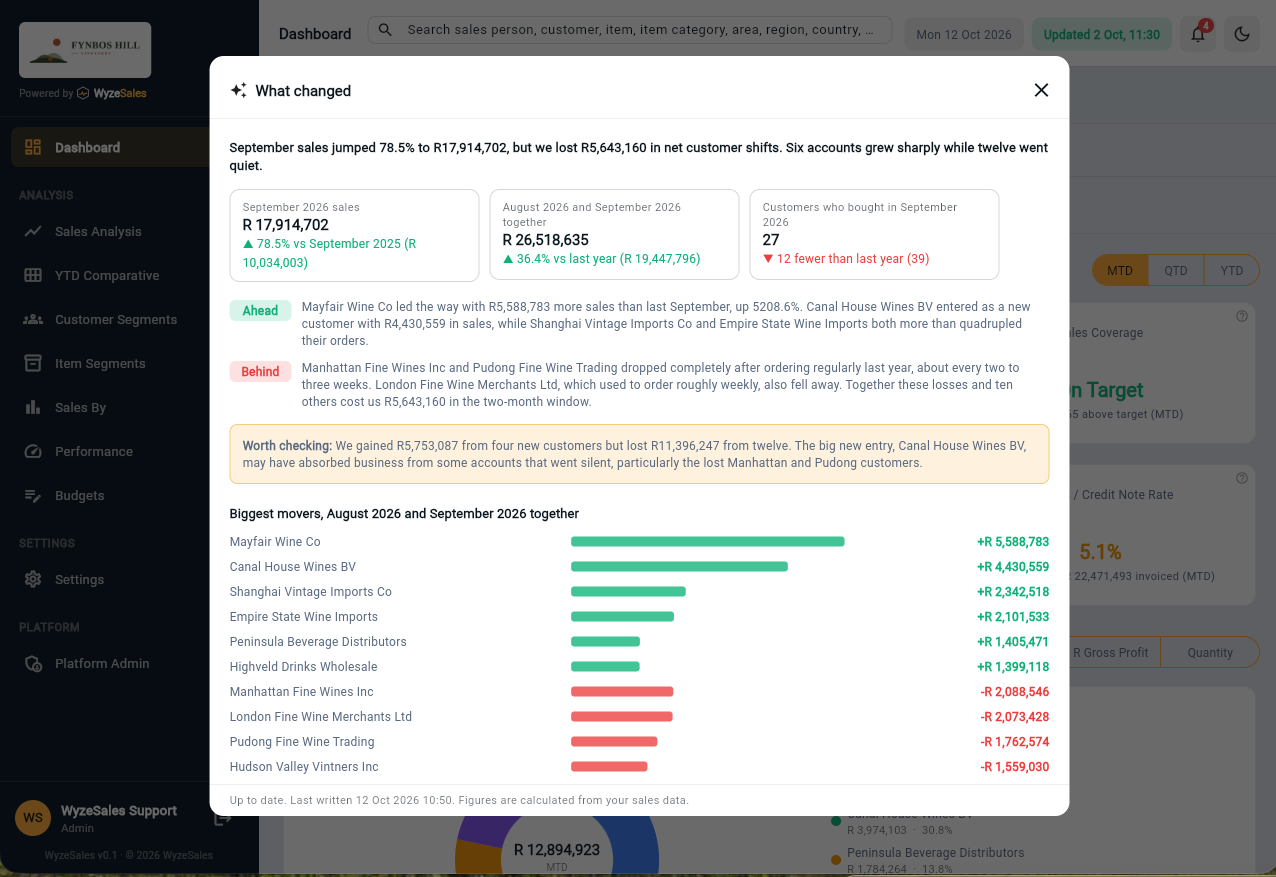
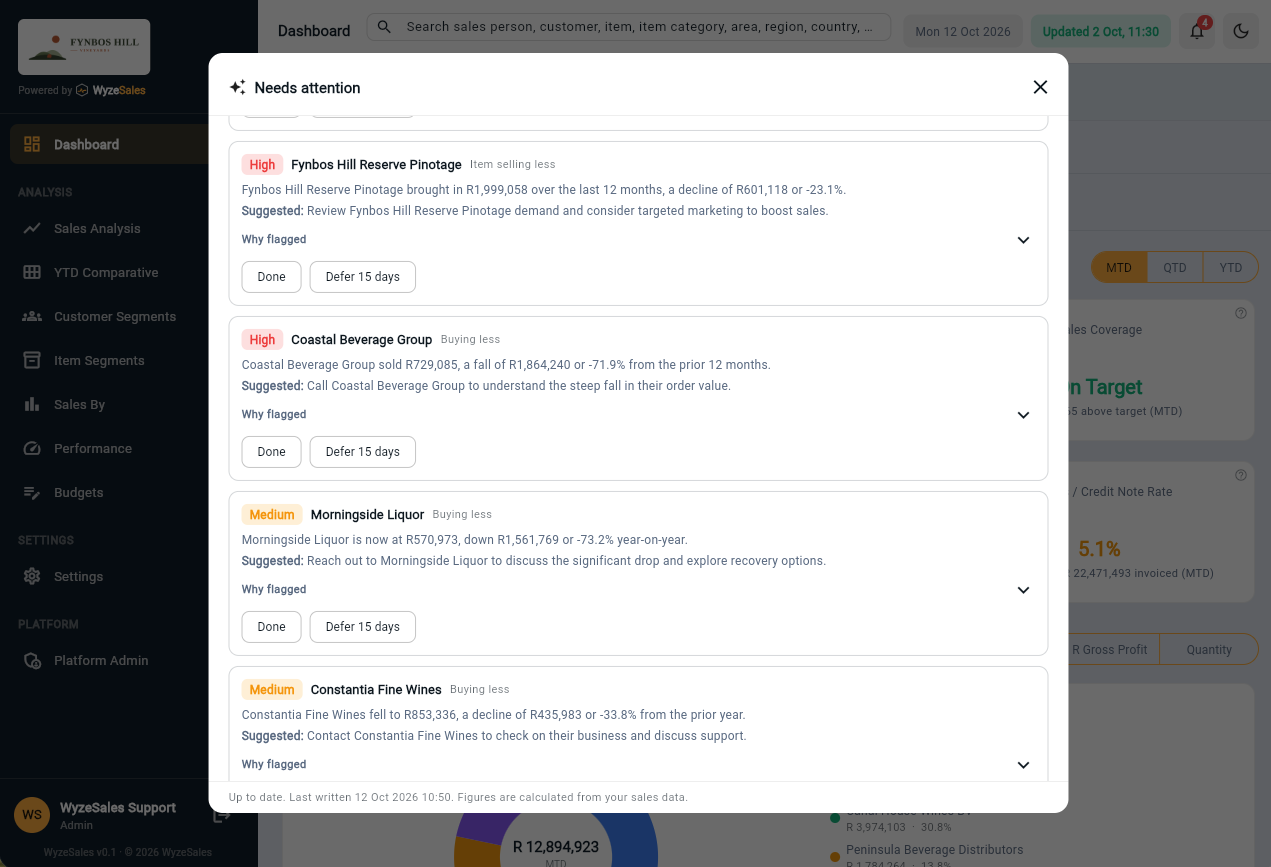
Two buttons on your Dashboard turn your sales into a short plain-English briefing and a prioritised list of customers and products to check, each with a suggested next step. Available on request.
- What changed: last month against the same month last year, and who is behind or ahead
- Needs attention: customers who have gone quiet or are buying less, and best-sellers that are slipping
- High, Medium and Watch priorities, so you start with what matters most
- Mark items Done or Defer them, so the whole team sees the same list
See sales the way you actually think about them
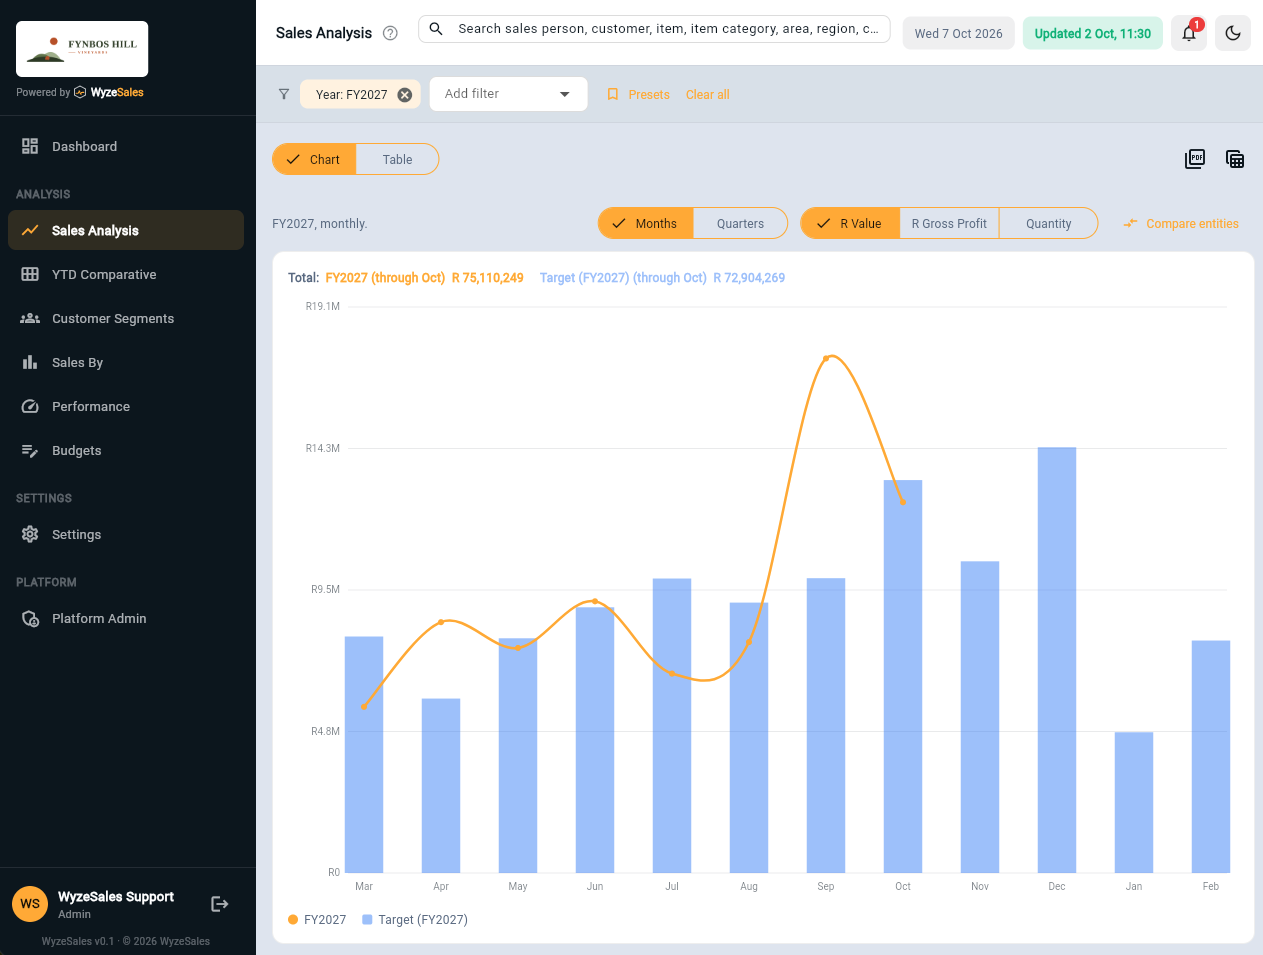
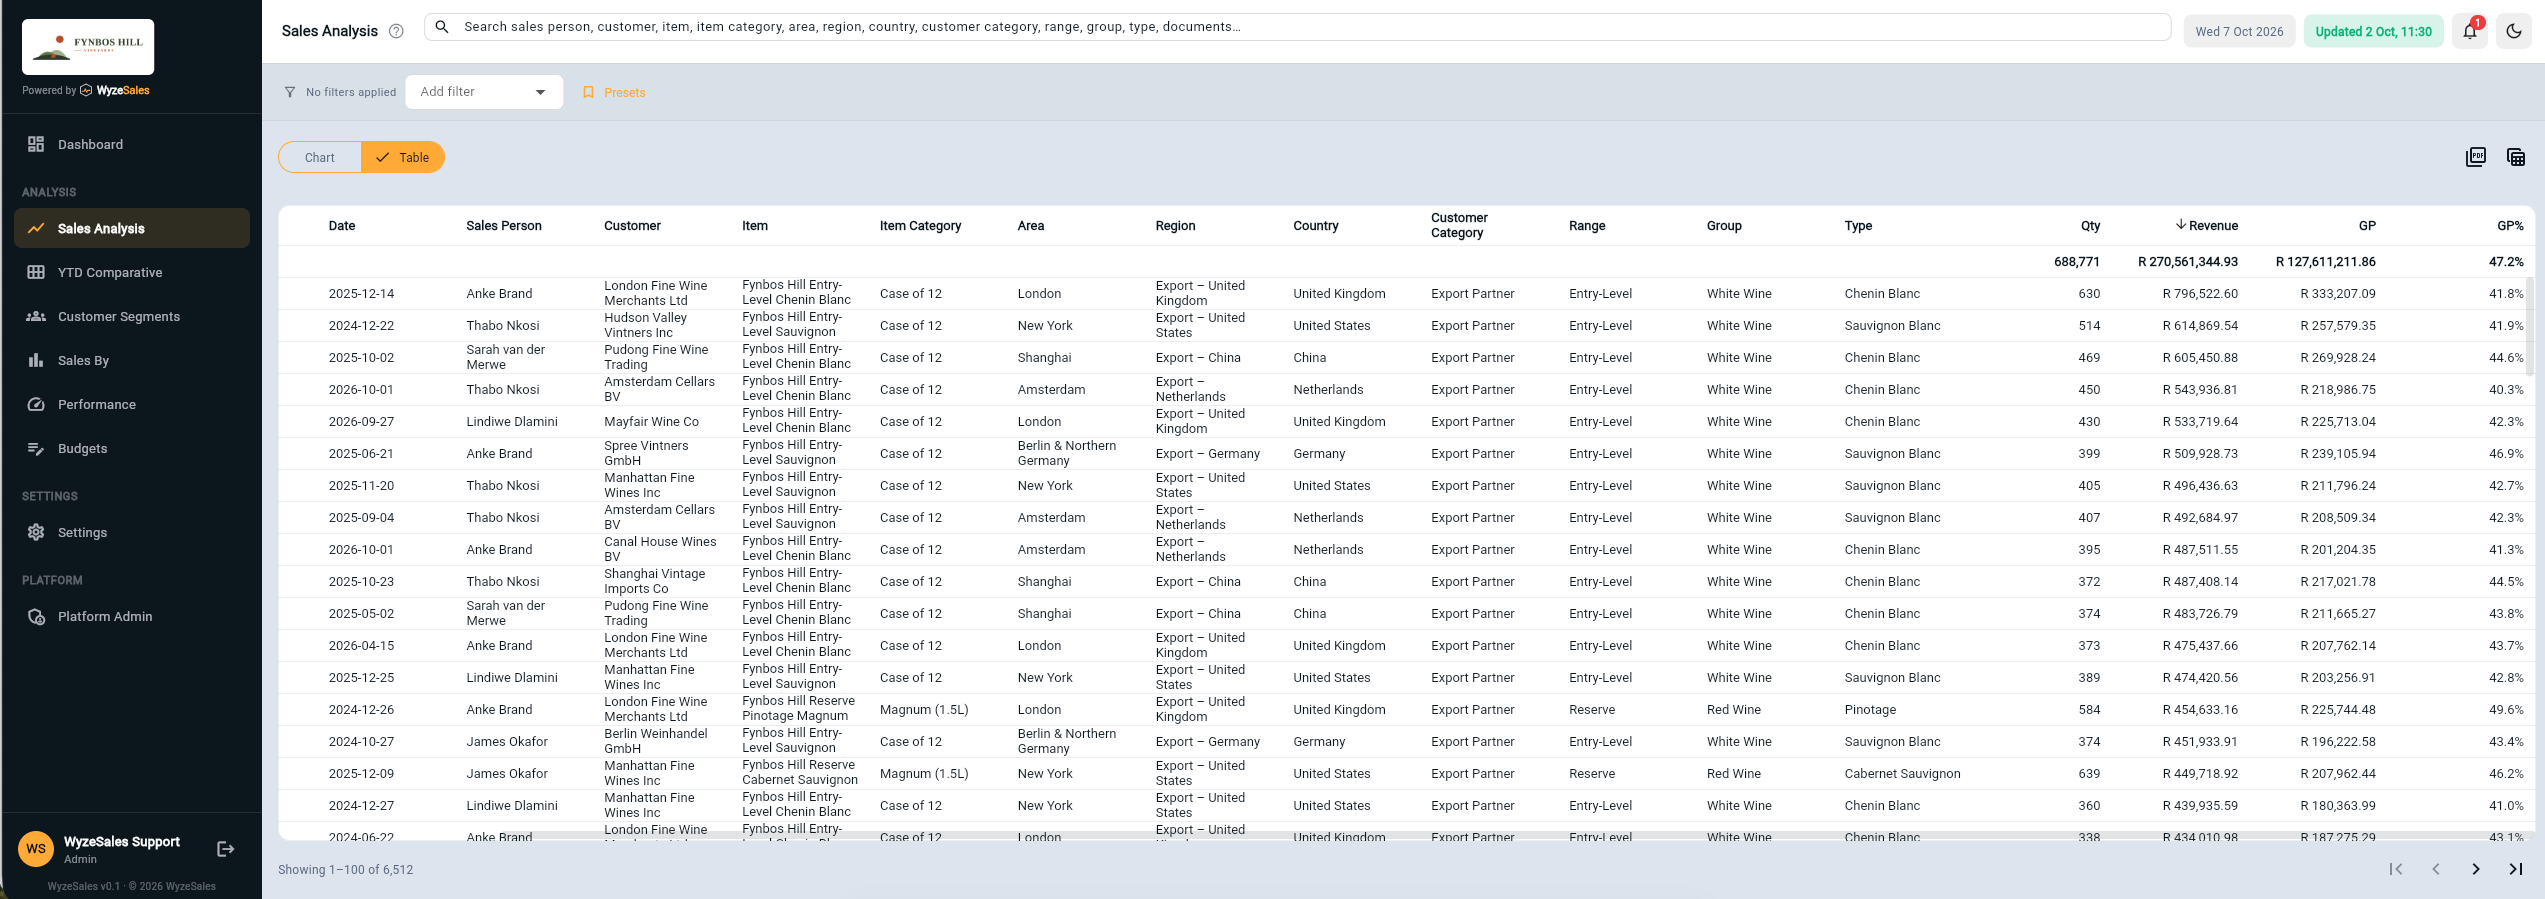
Every invoice line, filterable by sales person, customer, item, category, area, region, country, customer category, range, group or type. Switch between chart and table in a click.
- Full invoice-level detail, not just summaries
- Months or quarters, in rand value, gross profit or quantity
- Your target overlaid on the trend, so you see the gap as it opens
- Compare entities side by side on one chart
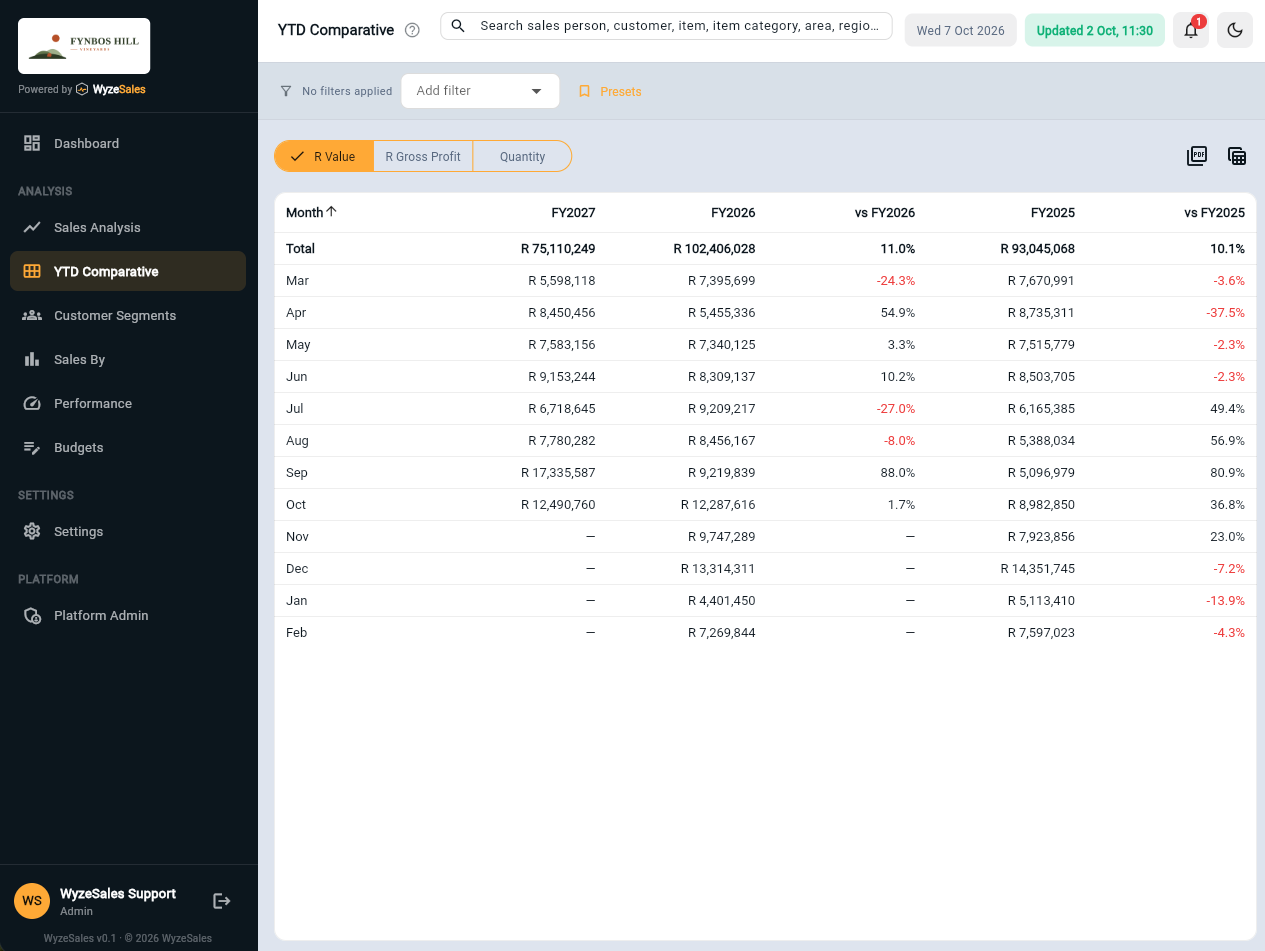
This year against the last two, month by month
See at a glance whether you are ahead of last year, and whether last year was itself a good one. Totals compare like for like months, so a part-finished year never looks like a collapse.
- Three financial years side by side, with variance for each
- Rand value, gross profit or quantity
- Group by any dimension, not just by month
- Export to PDF or Excel
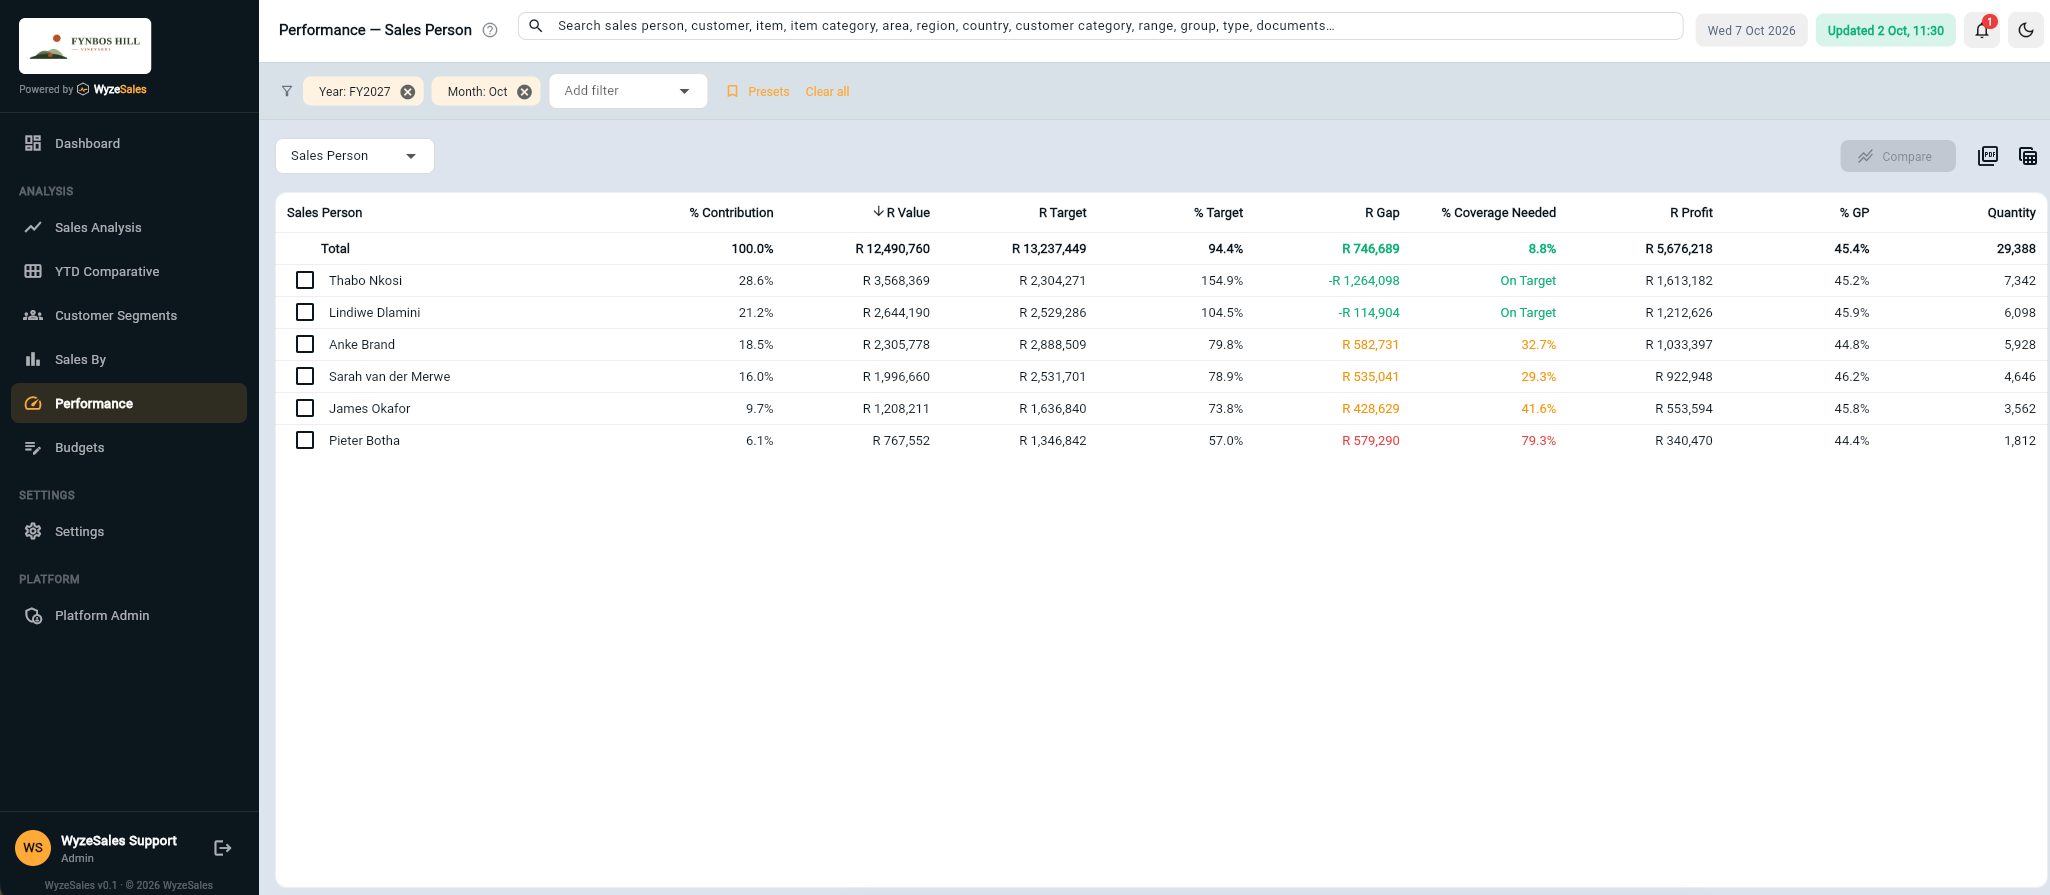
Spot what is working, and what is slipping, in one glance
% of target, rand gap, how much more coverage you still need, and gross profit, by sales person or any other dimension. Underperformance shows up in red before it becomes a problem.
- % target, rand gap and coverage needed, side by side
- Colour-coded: on target, behind, or well behind
- Gross profit and quantity in the same view
- Switch the whole table between sales person, category and other dimensions
Budgets that adjust for the season, not just the average
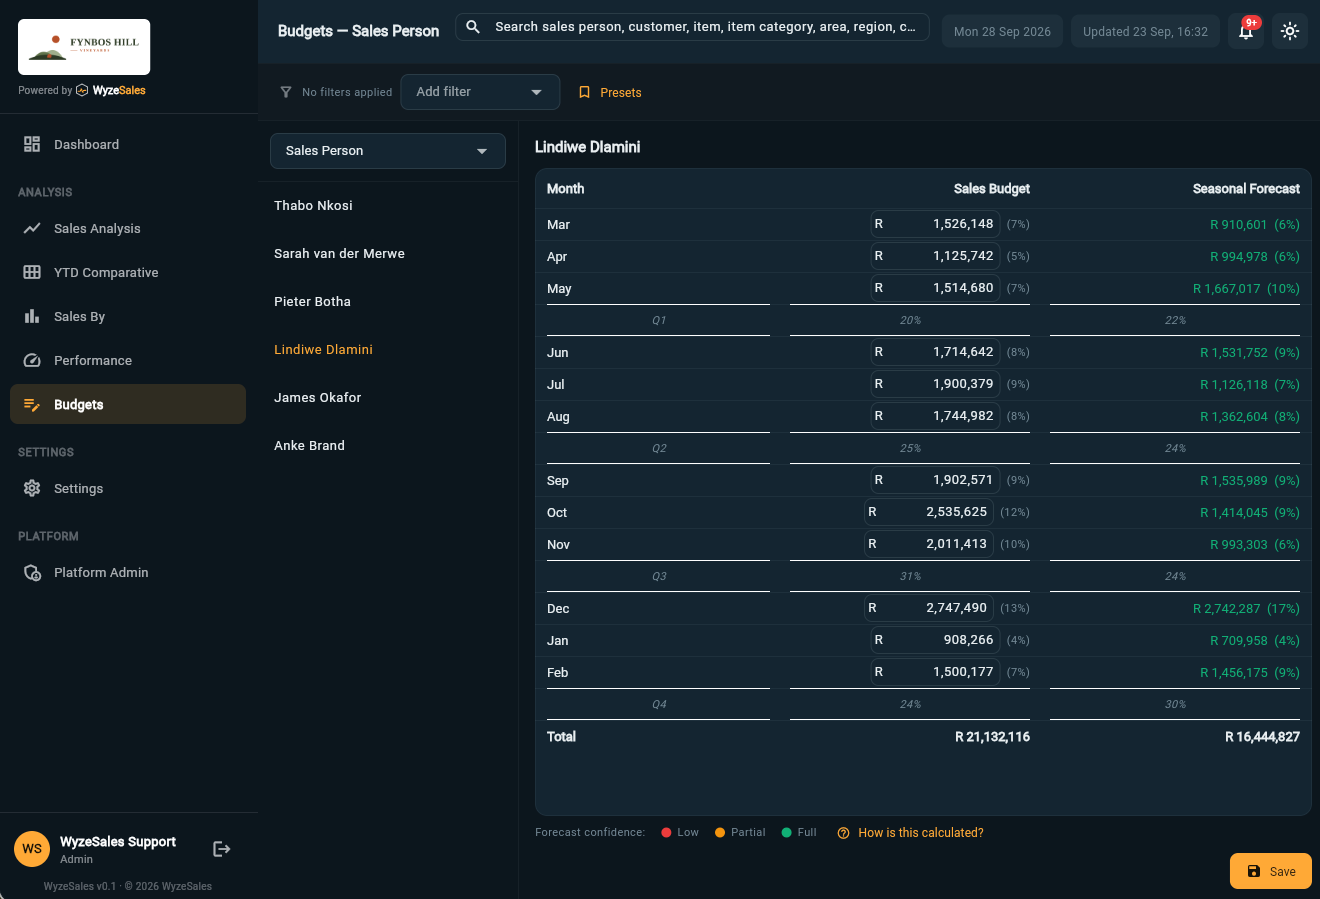
Set monthly targets per sales person and watch a seasonal forecast fill in the months ahead, each one rated for how much to trust it.
- Monthly budget breakdown, per sales person, with quarterly rollups
- Seasonal forecast alongside every budget line
- Low / partial / full confidence rating on every projection
Alerts, search and filters that keep up with you
The bell tells you first
WyzeSales watches for customers, sales people and branches selling at a loss, and for anyone running behind their pro-rated budget by more than you decide is acceptable. The alert is waiting before the month-end meeting.
Search it, filter it, save it
Type a name into the search bar to find any sales person, customer, item, area, region or document. Add filters from the full list of dimensions, and save the combinations you use every week as presets.
No exports. No spreadsheets. No one has to remember to run anything.
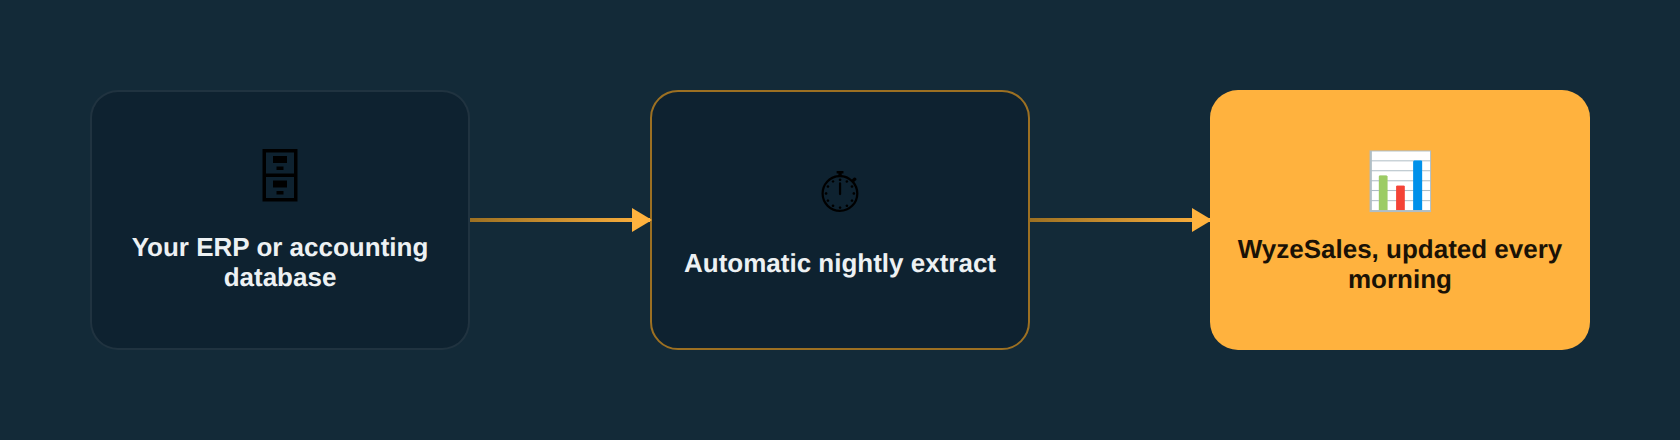
WyzeSales connects directly to your ERP or accounting database and pulls a fresh extract every night, so the dashboards are simply ready each morning.
- Direct connection to your ERP or accounting database
- Fully automatic nightly extract
- Updated and ready every morning, no action needed
The details that make it fit
Small touches that make WyzeSales feel built for your business.
Your financial year
Years, quarters and "year to date" follow your fiscal calendar, not January to December. A March year end just works.
Role-based access
Every client and every user gets exactly the access they should, securely separated, per branch and per role.
Your terminology
Dimensions are set up for each business, so the screens talk about areas, ranges and customer categories the way you already do.
Export to PDF and Excel
Any screen you are looking at can be handed on as a PDF for the board pack or a spreadsheet for someone who wants to dig further.
Light and dark, any device
Fully responsive on desktop, tablet and phone, with a light and a dark theme to suit the room.
Saved presets
Save the filter combinations you use every week, such as one region's key accounts, and bring them back in a click.
Let's see if WyzeSales fits your business
Tell us a bit about your setup and we'll get back to you, usually within a business day.
For ERP or accounting partners, see how we work with you. Download the one-page overview (PDF).